CONFUSION MATRIX/CYBER-CRIME

A Confusion matrix is an N x N matrix used for evaluating the performance of a classification model, where N is the number of target classes. The matrix compares the actual target values with those predicted by the machine learning model. The rows represent the predicted values of the target variable.
In the field of machine learning and specifically, the problem of statistical classification, a confusion matrix, also known as an error matrix, is a specific table layout that allows visualization of the performance of an algorithm, typically a supervised learning one (in unsupervised learning it is usually called a matching matrix). Each row of the matrix represents the instances in an actual class while each column represents the instances in a predicted class, or vice versa — both variants are found in the literature. The name stems from the fact that it makes it easy to see whether the system is confusing two classes (i.e. commonly mislabeling one as another).
It is a special kind of contingency table, with two dimensions (“actual” and “predicted”), and identical sets of “classes” in both dimensions (each combination of dimension and class is a variable in the contingency table)
Let’s discuss the Confusion Matrix Table in detail

TERMS
True Positive: You predicted positive and it’s true.
True Negative: You predicted negative and it’s true.
False Positive(Type 1 Error): You predicted positive and it’s false
False Negative(Type 2 Error): You predicted negative and it’s false.
What are Type 1 and Type 2 Error?
Type 1 Error
Type I error, also known as a “false positive”: the error of rejecting a null hypothesis when it is actually true. In other words, this is the error of accepting an alternative hypothesis (the real hypothesis of interest) when the results can be attributed to chance. Plainly speaking, it occurs when we are observing a difference when in truth there is none (or more specifically — no statistically significant difference). So the probability of making a type I error in a test with rejection region R is 0 P R H ( | is true).
Type 2 Error
Type II error, also known as a “false negative”: the error of not rejecting a null hypothesis when the alternative hypothesis is the true state of nature. In other words, this is the error of failing to accept an alternative hypothesis when you don’t have adequate power. Plainly speaking, it occurs when we are failing to observe a difference when in truth there is one. So the probability of making a type II error in a test with rejection region R is 1 ( | is true) − P R Ha. The power of the test can be ( | is true) P R Ha.
CYBERCRIMES

Cybercrime, also called computer crime, the use of a computer as an instrument to further illegal ends, such as committing fraud, trafficking in child pornography and intellectual property, stealing, identities, or violating privacy. Cybercrime, especially through the Internet, has grown in importance as the computer has become central to commerce, entertainment, and government.
Cybercrime is vastly growing in the world of tech today. Criminals of the World Wide Web exploit internet users’ personal information for their own gain. They dive deep into the dark web to buy and sell illegal products and services. They even gain access to classified government information.
Cybercrime will more than triple the number of unfilled cybersecurity jobs by 2021
The global cost of cybercrime will reach $6 trillion by 2021.
In the present world, cybercrime offenses are happening at an alarming rate. As the use of the Internet is increasing many offenders, make use of this as a means of communication in order to commit a crime. The framework developed in our work is essential to the creation of a model that can support analytics regarding the identification, detection, and classification of integrated cybercrime offenses (structured and unstructured). The main focus of our work is to find the attacks that take advantage of the security vulnerabilities and analyze these attacks by making use of machine learning techniques.
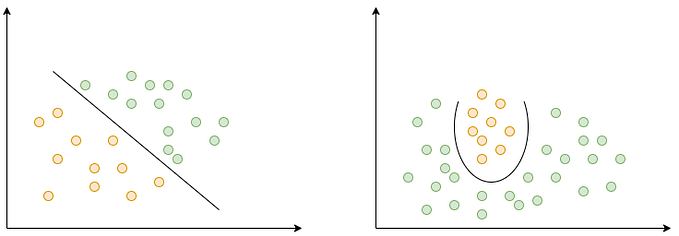
Cyber Attack Detection and Classification Using Parallel Support Vector Machine
A number of cyber-attack detection and classification methods have been introduced with different levels of success that are used as a countermeasure to preserve data integrity and system availability from attacks. We proposed a Parallel Support Vector Machine (pSVM) algorithm for the detection and classification of cyber attack datasets Basically, cyber attack detection is a classification problem, in which we classify the normal pattern from the abnormal.
The classification accuracy of PSVM remarkably improve (accuracy for Normal class as well as DOS class is almost 100%) and comparable to false alarm rate and training, testing times.
The proposed Parallel Support Vector Machine algorithm is evaluated using KDD1999 intrusion detection datasets. The first drawback is that SVM is very sensitive to attacks. The second, SVM designed for the two-class problems it has to be extended for the multiclass problem by choosing a suitable kernel function. Decision-tree-based support vector machine which combines support vector machines and decision tree can be an effective way for solving multi-class problems.
Improved Support Vector Machine (iSVM) algorithm for classification of cyber attack dataset which gives 100% detection accuracy for Normal and Denial of Service (DOS) classes and comparable to false alarm rate, training, and testing times
For each TCP/IP connection, 41 various quantitative (continuous data type) and qualitative (discrete data type) features were extracted among the 41 features, 34 features (numeric), and 7 features (symbolic).
DR(Detection Rate)is computed as the ratio between the number of correctly detected attacks and the total number of attacks, while the false alarm (false positive) rate is computed as the ratio between the number of normal connections that is incorrectly misclassified as attacks and the total number of normal connections.

In the KDD Cup 99, the criteria used for evaluation of the participant entries is the Cost Per Test (CPT) computed using the confusion matrix and a given cost matrix. A Confusion Matrix (CM) is a square matrix in which each column corresponds to the predicted class, while rows correspond to the actual classes


Conclusion
This research presents new cyber attack detection and classification system to classify cyber attacks. In this, we developed the performance of IDS using a parallel support vector machine for distributed cyber-attack detection and classification. The new PSVM is shown more efficient for the detection and classification of different types of cyber attacks compared to SDF. The experimental results on the KDD99 benchmark dataset manifest that the proposed algorithm achieved a high detection rate on different types of network attacks.
Thank you for reading my blog:)